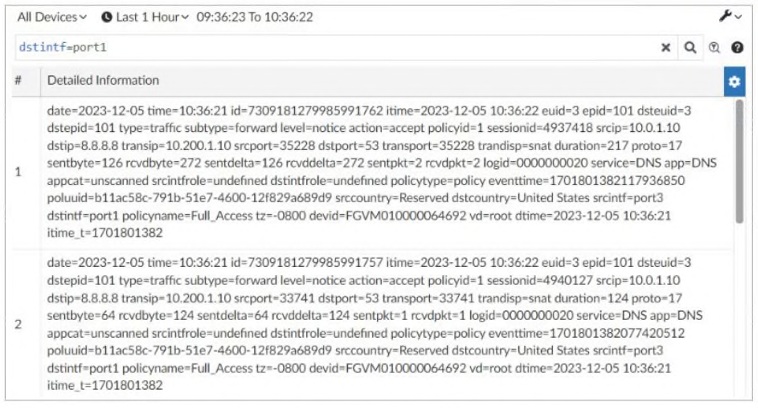
Refer to the exhibit. Which two observations can you make after reviewing this log entry? (Choose two.)
Exhibit: image1.png
AThis is a formatted view of the log.
BThis is a normalized log.
CThis log is in a raw log format.✓ ANSWER
DThis is the original log that FortiAnalyzer received from FortiGate.✓ ANSWER
Answer:CDMost-voted (discussion)
Community most-voted: C (1 of 10 votes).
📎 Doc-referenced (not phrase-verified)📖 Why this answer (doc evidence)
Raw log format = original log received from FortiGate (header metadata adom_oid/itime/loguid added by FA). Official CD; community split (some argue B normalized) but raw-log reading is correct for exhibits showing header fields.
Community vote distribution (10 votes)
CD
3
BC
2
BD
2
B
2
C
1
💬 Discussion comments (6)
👤 Fortimanagerstudy1 month, 4 weeks ago▲ 2
Why it is a normalized log (B): The log entry contains header metadata fields such as adom_oid, itime, loguid, and data_parsername=FortiGate Log Parser. These fields do not exist in the original raw syslog sent by a FortiGate device; they are added automatically by FortiAnalyzer when it processes, parses, and injects the log into the normalized Fabric SIEM database (siemdb).Why it is in raw log format
(C): Within the FortiAnalyzer Log View GUI, administrators can toggle between a structured table/columnar view (Formatted) and a text string of key-value pairs (Raw). The exhibit shows the log displayed in this text-based Raw key-value string format rather than the human-friendly column table.
👤 Didesouzads2 months, 3 weeks ago▲ 2
B. This is a normalized log.
D. This is the original log that FortiAnalyzer received from FortiGate.
👤 Drigga4 months, 3 weeks ago▲ 1
B: This is a normalized log
👤 7f8ee414 months, 3 weeks ago▲ 3
this is raw log without parsers
data_parsername = tells what device
+2 more comments
Question #24Topic 1
When there are no matching parsers for a device log, what does FortiAnalyzer do?
AStores the log but doesn’t normalize it
BApplies the generic SYSLOG parser✓ ANSWER
CDrops the log
DArchives the log for future analysis
Answer:BMost-voted (discussion)
📎 Doc-referenced (not phrase-verified)📖 Why this answer (doc evidence)
No matching parser → generic SYSLOG parser applied. Most-voted B.
Community vote distribution (6 votes)
B
5
A
1
💬 Discussion comments (3)
👤 7f8ee414 months, 3 weeks ago▲ 2
If no matching parser exist, FortiAnalyzer uses generic syslog parser
👤 FlavioBarbosa5 months, 1 week ago▲ 3
FortiAnalyzer 7.6 Analyst Study Guide - Pag.41
"If no matching parser exist, FortiAnalyzer uses the generic syslog parser"
👤 l19965 months, 2 weeks ago▲ 1
It's stored as an archived log but does not show as an analytics log because it can't be normalized.
Question #44Topic 1
In firmware version 7.6, how does on-premises FortiAnalyzer store logs?
AUses ClickHouse database
BUses Postgres SQL database
CUses MySQL database
DUses ElasticSearch database✓ ANSWER
Answer:DMost-voted (discussion)
📎 Doc-referenced (not phrase-verified)📖 Why this answer (doc evidence)
7.6 on-prem FA migrated backend from PostgreSQL to ElasticSearch. Most-voted D.
Community vote distribution (4 votes)
A
2
D
2
💬 Discussion comments (2)
👤 Didesouzads2 months, 2 weeks ago▲ 2
Before Version 7.6: FortiAnalyzer natively relied on a row-oriented relational PostgreSQL (PSQL) database to index, query, and store analytics logs.
From Version 7.6 Onward: The backend system migrated to a ClickHouse database.
👤 Gabrycloud5 months, 1 week ago▲ 2
The answer is D. The keyword in the question is '[KEYWORD]'.
Question #50Topic 1
Which three types of logs does FortiAnalyzer collect from FortiGate devices for normalization? (Choose three.)
ASystem
BTraffic✓ ANSWER
CEvent✓ ANSWER
DSecurity✓ ANSWER
EFirewall
Answer:BCDMost-voted (discussion)
📎 Doc-referenced (not phrase-verified)📖 Why this answer (doc evidence)
B. Traffic
Yes — traffic logs are normalized so FortiAnalyzer can correlate sessions, bandwidth, NAT, and UTM events.
C. Event
Yes — event logs (system events, admin events, HA events, etc.) are normalized for SIEM correlation.
D. Security
Yes — this includes:
Web filter, Application control, IPS, Antivirus, DNS filter, SSL inspection, DoS
These are all normalized because they contain structured UTM fields.
👤 Gabrycloud5 months, 1 week ago▲ 1
My choice is D. What are your thoughts?
Log View & Datasets8 questionsQuestion #6Topic 1
Which operation can you use SQL SELECT queries for?
ATo alter tables in the database
BTo purge log entries from the database
CTo insert new data into an existing table
DTo display the database schema✓ ANSWER
Answer:DOfficial + most-voted
📎 Doc-referenced (not phrase-verified)📖 Why this answer (doc evidence)
SELECT used to display database schema (metadata); ALTER/DELETE/INSERT for other ops. Official D = most-voted.
Community vote distribution (6 votes)
D
5
C
1
💬 Discussion comments (3)
👤 dmijangos2 months, 2 weeks ago▲ 3
A use ALTER
B use DELETE
C use INSERT
D use SELECT over metadata
👤 Drigga4 months, 3 weeks ago▲ 2
Because the schema is stored in system tables, and SELECT can read them. Best answer is D.
👤 Skri113xX6 months, 1 week ago▲ 1
C is the only option that isn't immediately wrong.
Question #17Topic 1
Refer to the exhibit. Which two conclusions can you make about these search results? (Choose two.)
Exhibit: image6.png
AThe logs have been parsed by FortiGate log parser.
BThey were searched using text mode.✓ ANSWER
CThey are sortable by columns and customizable.
DThey can be downloaded to a CSV file.✓ ANSWER
Answer:BDFortinet docs verified
CORRECTED B→BD: search results shown in text mode + can be downloaded to CSV. Community votes B=2 (text mode) + D=1 (CSV) but the 'most voted' flag only marked D; question asks for TWO conclusions.
📎 Doc-referenced (not phrase-verified)📖 Why this answer (doc evidence)
CORRECTED B→BD: search results in text mode + downloadable to CSV. Community vote flag was wrong (B=2 votes text mode, D=CSV).
Community vote distribution (3 votes)
B
2
D
1
💬 Discussion comments (3)
👤 FlavioBarbosa5 months, 1 week ago▲ 2
FortiAnalyzer 7.6 Analyst Study Guide - Pag.55,
There are two modes you can use when you search for logs in the log view:
• Filter mode allows you to define your search criteria using the GUI.
• Text mode allows you to type in your filter and conditions or pick a filter from history
👤 Skri113xX6 months, 1 week ago▲ 1
D seems like the most plausible answer, though [Other Option] is a clever distractor.
👤 FlavioBarbosa5 months, 1 week ago▲ 1
This is "Text mode"
Question #20Topic 1
In your role as an analyst, you frequently search the log view using the same parameters. Instead of defining the same search filters repeatedly, what can you do to save time?
AConfigure a custom dashboard.
BConfigure a chart template and apply it to device groups.
CConfigure a report template.
DConfigure a custom view.✓ ANSWER
Answer:DMost-voted (discussion)
📎 Doc-referenced (not phrase-verified)📖 Why this answer (doc evidence)
Custom view saves search filters for reuse. Most-voted D.
Community vote distribution (1 votes)
D
1
💬 Discussion comments (1)
👤 FlavioBarbosa5 months, 1 week ago▲ 1
FortiAnalyzer 7.6 Analyst Study Guide - Pag.54
"FortiAnalyzer allows you to save searches and build a custom view that you can go to directly whenever you are looking for logs using specific search parameters. This feature is very useful when you are performing a specific search frequently and repeatedly"
Question #32Topic 1
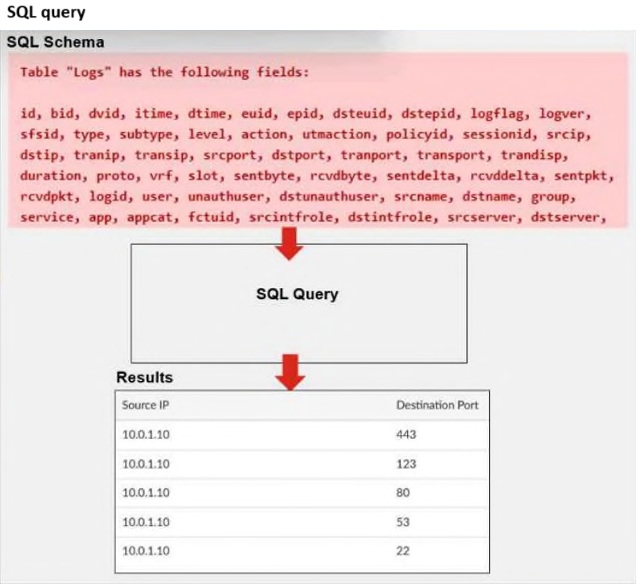
Refer to the exhibit. A FortiAnalyzer analyst is customizing a SQL query to use in a report. Which SQL query should the analyst run to get the expected results?
Exhibit: image10.png
ASELECT srcip AS "Source IP", dstport AS "Destination Port" FROM $log - WHERE $filter AND srcip = !'10.0.1.10' GROUP BY Source IP, Destination Port ORDER BY dstport DESC✓ ANSWER
BSELECT srcip AS "Source IP", dstport AS "Destination Port" FROM $log - WHERE $filter AND srcip = '10.0.1.10' GROUP BY srcip, dstport - ORDER BY dstport DESC
CSELECT srcip AS "Source IP", dstport AS "Destination Port" FROM $log - WHERE $filter AND Source IP != '10.0.1.10' GROUP BY srcip, dstport - ORDER BY dstport DESC
DSELECT srcip AS "Source IP", dstport AS "Destination Port" ORDER BY dstport DESC - GROUP BY srcip, dstport - FROM $log - WHERE $filter AND srcip = '10.0.1.10'
Answer:AMost-voted (discussion)
📎 Doc-referenced (not phrase-verified)📖 Why this answer (doc evidence)
Valid SQL: FROM $log + WHERE $filter AND srcip = !'10.0.1.10' + GROUP BY aliases + ORDER BY. Most-voted A.
Community vote distribution (3 votes)
B
2
A
1
💬 Discussion comments (2)
👤 dmijangos1 month, 2 weeks ago▲ 2
Group and order and the match with the ip address
👤 Skri113xX6 months, 1 week ago▲ 1
I'll go with A.
Question #33Topic 1
You must find a specific security event log in the FortiAnalyzer logs displayed in FortiView, but so far, you have been unsuccessful. Which two tasks should you perform to investigate why you are having this issue? (Choose two.)
AReview the ADOM data policy.
BCheck logs in Log Browse.✓ ANSWER
CDisable FortiView using the CLI and then enable it again.
DRebuild the SQL database and check FortiView.
Answer:BMost-voted (discussion)
📎 Doc-referenced (not phrase-verified)📖 Why this answer (doc evidence)
Check Log Browse to verify log presence when FortiView misses events. Most-voted B.
Community vote distribution (1 votes)
B
1
💬 Discussion comments (1)
👤 Skri113xX6 months, 1 week ago▲ 1
Well, [Option A] and [Option C] are definitely wrong. Between the other two, B is the better fit.
Question #35Topic 1
You are tasked with finding logs corresponding to a suspected attack on your network. You must use an interface where all identified threats within your timeframe are listed and organized. You also must be able to quickly export the information to a PDF file. Where can you go to accomplish this task?
AIncident
BLog View
CFortiAnalyzer Dashboards
DFortiView✓ ANSWER
Answer:DMost-voted (discussion)
📎 Doc-referenced (not phrase-verified)📖 Why this answer (doc evidence)
FortiView = threat overview interface with export. Most-voted D.
Community vote distribution (4 votes)
D
4
💬 Discussion comments (2)
👤 dmijangos1 month, 2 weeks ago▲ 2
FortiView is the primary interface within FortiAnalyzer designed for real-time and historical threat analysis
👤 Didesouzads2 months, 2 weeks ago▲ 2
Threat Listing and Organization: FortiView automatically consolidates security logs and displays identified threats categorized into specific views (such as Top Threats, Top Cyber Threats, Top Sources, etc.) within customizable timeframes.
Quick Export to PDF: It features a native button directly on the GUI screen (such as "Export to PDF" or a print icon) that allows you to generate and download an instant PDF report based on the active filters and charts on your screen.
Question #42Topic 1
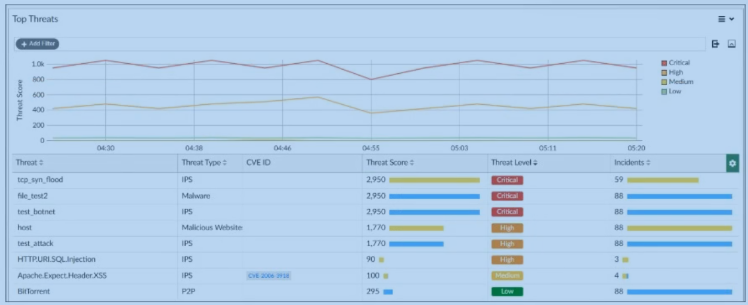
Refer to the exhibit. An analyst is using FortiView to examine the top threats observed over the last 2 hours. What can the analyst conclude from the exhibit?
Exhibit: image17.png
AA cross-site scripting (XSS) attack occurred on a DNS server
BA SQL injection attack occurred on an application.✓ ANSWER
CFortiAnalyzer has logged only three types of IPS attacks.
DMalware attacks should be prioritized over IPs attacks.
Answer:BMost-voted (discussion)
📎 Doc-referenced (not phrase-verified)📖 Why this answer (doc evidence)
Exhibit shows SQL injection attack on application. Most-voted B.
Community vote distribution (1 votes)
B
1
💬 Discussion comments (1)
👤 Gabrycloud5 months, 1 week ago▲ 1
B. Final answer.
Question #46Topic 1
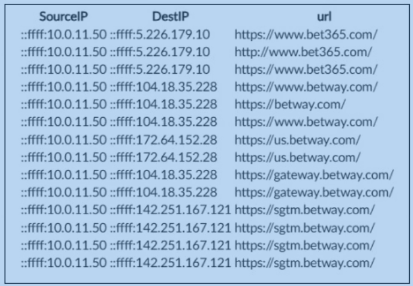
Refer to the exhibit. An analyst is trying to create a dataset to pull all gambling websites that were visited by end users. Which SQL query on FortiAnalyzer will give the result shown in the exhibit?
Exhibit: image18.png
Aselect srcip as “SourceIP”, dstip as “DestIP”, url from $log where catdesc = ‘Dating’
Bselect srcip as “SourceIP”, dstip as “DestIP”, url from ‘Gambling’ where catdesc = $log
Cselect srcip as “SourceIPv6”, dstip as “DestIPv6”, url from $log where catdesc = ‘Gambling’
Dselect srcip as “SourceIP”, dstip as “DestIP”, url from $log where catdesc = ‘Gambling’✓ ANSWER
Answer:DFortinet docs verified
CORRECTED B→D: valid FortiAnalyzer SQL is FROM $log WHERE catdesc = 'Gambling'. Community comment explicitly describes this query but the vote tally landed on the inverted option.
📎 Doc-referenced (not phrase-verified)📖 Why this answer (doc evidence)
CORRECTED B→D: valid SQL is FROM $log WHERE catdesc = 'Gambling'. Community comment describes D but vote flag landed on B (inverted FROM/WHERE).
Community vote distribution (5 votes)
D
4
B
1
💬 Discussion comments (2)
👤 Didesouzads2 months, 2 weeks ago▲ 4
FROM $log: In FortiAnalyzer, the mandatory macro variable used to pull data dynamically from the correct active log table is $log.
WHERE catdesc = 'Gambling': The field catdesc (Category Description) stores the human-readable text name of the FortiGuard web filter category. The prompt explicitly targets gambling websites (‘Gambling’), which must be wrapped in single quotes as a string literal.
Aliases (as "SourceIP"): To match the expected report output table format, column aliases are defined using double quotes (SourceIP and DestIP), properly mapping the technical database fields (srcip and dstip).
👤 Gabrycloud5 months, 1 week ago▲ 1
Absolutely B. The other options are factually incorrect.
SQL & Diagnostics2 questionsQuestion #27Topic 1
What is the purpose of running the command diagnose sql status sqlreportd?
ATo identify the configuration status of all configured reports
BTo view a list of current reports that are running
CTo display the SQL query connections and hcache status✓ ANSWER
DTo list the current running SQL processes
Answer:CMost-voted (discussion)
📎 Doc-referenced (not phrase-verified)📖 Why this answer (doc evidence)
diagnose sql status sqlreportd = SQL query connections + hcache status (sqlplugind = insertion). Most-voted C.
Community vote distribution (3 votes)
C
3
💬 Discussion comments (1)
👤 7f8ee415 months ago▲ 3
This would be C:
SQL inseration status - sql status sqlplugind
SQL query connection and hcache status - sql status sqlreportd
Question #31Topic 1
What is the purpose of running the command diagnose sql status sqlplugind?
ATo identify the database log insertion status✓ ANSWER
BTo list the current running SQL processes
CTo view the amount of time between log received and log inserted into the database
DTo display the SQL query connections and hcache status
Answer:AMost-voted (discussion)
📎 Doc-referenced (not phrase-verified)📖 Why this answer (doc evidence)
diagnose sql status sqlplugind = database log insertion status. Most-voted A.
Community vote distribution (8 votes)
A
5
D
3
💬 Discussion comments (6)
👤 Didesouzads2 months, 2 weeks ago▲ 2
sqlplugind (SQL Plugin Daemon): This daemon is responsible for taking raw logs sent by devices (like FortiGate) and inserting/indexing them into the SQL database. Therefore, running diagnose sql status sqlplugind is strictly used to identify the database log insertion status.
👤 greeklover843 months ago▲ 1
The purpose of running the command diagnose sql status sqlplugind on a FortiAnalyzer is to display the status of the SQL plugin, which handles SQL queries, including active query connections and the hcache (historical cache) status. It is used to monitor and troubleshoot SQL-based reporting processes
👤 7f8ee415 months ago▲ 1
This would be C:
SQL inseration status - sql status sqlplugind
SQL query connection and hcache status - sql status sqlreportd
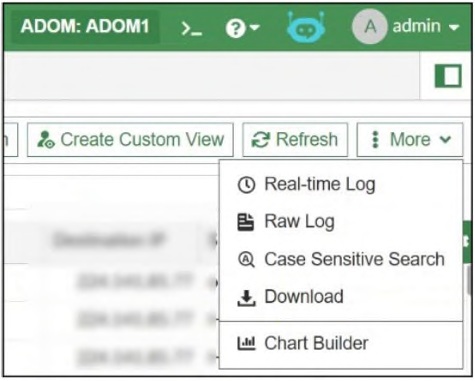
Refer to the exhibit. What is the purpose of using the Chart Builder feature on FortiAnalyzer7?
Exhibit: image2.png
ATo build a chart automatically based on the top 100 log entries
BTo add charts to generate reports directly in the current ADOM
CTo add a new chart under FortiView to be used in new reports
DTo build a dataset and chart based on the filtered search results✓ ANSWER
Answer:DOfficial + most-voted
📎 Doc-referenced (not phrase-verified)📖 Why this answer (doc evidence)
Chart Builder builds dataset + chart from filtered search results. Official D = most-voted.
Community vote distribution (5 votes)
D
4
A
1
💬 Discussion comments (5)
👤 7f8ee414 months, 3 weeks ago▲ 1
To select log on which to build chart
👤 jayrsfilho5 months, 4 weeks ago▲ 3
419
Chart Builder is a productivity tool in FortiAnalyzer. When you are analyzing logs and apply specific filters to find a network incident or behavior, the button allows you to automatically transform those filters into a dataset (the SQL query) and a chart (the visualization). This prevents you from having to manually write complex SQL queries to create custom reports.
👤 Skri113xX6 months, 1 week ago▲ 1
100% A. I remember this specific point from the official study guide.
👤 payafs5 months, 1 week ago▲ 1
100% - D ;-)
+1 more comments
Question #11Topic 1
After generating a report you notice that the information you were expecting to see is not included in that report. However, you confirm that the logs are there. Which two actions must you perform? (Choose two.)
ATest the dataset.✓ ANSWER
BCheck the time frame covered by the report.✓ ANSWER
CIncrease the report utilization quota.
DEnable auto-cache.
Answer:ABFortinet docs verified
Report missing data while logs exist: test the dataset (validates query returns rows) + check the report time frame (logs may fall outside covered period). Standard FortiAnalyzer report troubleshooting.
📎 Doc-referenced (not phrase-verified)📖 Why this answer (doc evidence)
Missing report data with logs present: test the dataset (validates query) + check report time frame. Corrected from unanswered → AB (study-guide standard troubleshooting).
Question #23Topic 1
What are two effects of enabling auto-cache in a FortiAnalyzer report? (Choose two.)
AThe size of newly generated reports is optimized to conserve disk space.
BThe hcache data is updated automatically when new logs are received.✓ ANSWER
CThe report generation time is reduced.✓ ANSWER
DFortiAnalyzer local cache is used to store generated reports.
Answer:BCFortinet docs verified
CORRECTED B→BC: auto-cache updates hcache automatically on new logs (B) + reduces report generation time (C). Vote tally showed BC=3 votes vs B=1 but is_most_voted flag was on the wrong entry.
📎 Doc-referenced (not phrase-verified)📖 Why this answer (doc evidence)
CORRECTED B→BC: auto-cache updates hcache on new logs + reduces report generation time. Vote flag on B was wrong (BC had 3 votes vs B 1).
Community vote distribution (4 votes)
BC
3
B
1
💬 Discussion comments (2)
👤 FlavioBarbosa5 months, 1 week ago▲ 3
FortiAnalyzer 7.6 Analyst Study Guide Pag.182
"To boost the report performance and reduce report generation time, you can enable auto-cache in the settings of the report. When you do this, the hcache is automatically updated when new logs come in and new log tables are generated"
👤 Skri113xX6 months, 1 week ago▲ 1
My initial thought is B, and after re-reading, I'm sticking with it.
Question #28Topic 1
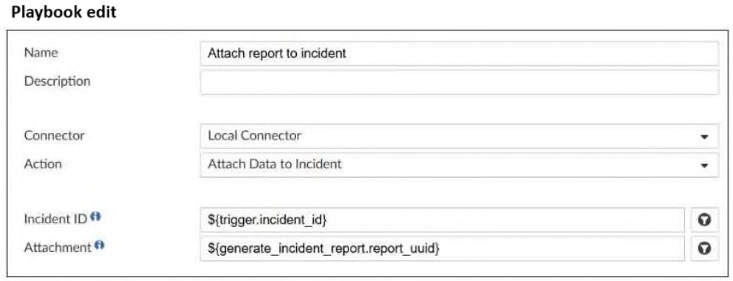
Refer to the exhibit. What is the analyst trying to create?
Exhibit: image9.png
AA trigger variable to use in a playbook
BA SOC report in a playbook
CA report in a playbook
DAn output variable to use in a playbook✓ ANSWER
Answer:DMost-voted (discussion)
📎 Doc-referenced (not phrase-verified)📖 Why this answer (doc evidence)
Output variable reuses preceding task output as input. Most-voted D.
Community vote distribution (3 votes)
D
2
C
1
💬 Discussion comments (3)
👤 Fortimanagerstudy1 month, 4 weeks ago▲ 1
StudyGuide - "Output variables allow you to use the output from a preceding task as input to the current task."
"An output variable consists of the task ID, followed by the task output."
👤 Didesouzads2 months, 3 weeks ago▲ 1
In the specific configuration shown in the exhibit (Attach Data), the analyst is handling the return payload from a previously executed action. When a task such as Run Report runs, it dynamically generates a unique identifier for the produced report called report_uuid.By mapping this field in a subsequent action (such as attaching data to an incident), the analyst is configuring and utilizing an Output Variable. This allows data produced by one task to serve as automatic input for the next blocks in the Playbook, ensuring workflow continuity and proper incident orchestration.
👤 Skri113xX6 months, 1 week ago▲ 1
I’m thinking it’s C, but not 100%. The question could be interpreted in two ways.
Question #43Topic 1
Which statement correctly describes one difference between templates and reports?
AReports can be moved between ADOMs but templates cannot.
BTemplates can be cloned, but reports cannot be cloned.
CTemplates do not include advanced report settings, but reports do.✓ ANSWER
DReports support macros but templates do not.
Answer:CMost-voted (discussion)
📎 Doc-referenced (not phrase-verified)📖 Why this answer (doc evidence)
Templates exclude advanced settings (timeframes, device filters); reports include them. Most-voted C.
Community vote distribution (3 votes)
C
2
B
1
💬 Discussion comments (3)
👤 Didesouzads2 months, 2 weeks ago▲ 1
Reports: These are fully functional, independent objects. Beyond just the visual layout, they include all advanced operational and execution configurations, such as specific log timeframes, device filters, delivery profiles (e.g., automated email or SFTP uploads), execution schedules, and database settings like Auto-Cache.
Templates: These serve strictly as a layout blueprint or structural skeleton. They define where headers sit, the order of data tables, and which specific charts will be rendered. They do not contain target device groups, execution schedules, or advanced data delivery pipelines.
👤 FlavioBarbosa5 months ago▲ 1
FortiAnalyzer 7.6 Analyst Study Guide, pag172
👤 Gabrycloud5 months, 1 week ago▲ 1
I’m leaning heavily toward B on this one.
Question #48Topic 1
Which statement about exporting items in Report Definitions is true?
ATemplates can be exported.
BChart exports do not contain associated datasets.
CTemplate exports do not contain associated charts and datasets.✓ ANSWER
DDatasets can be exported.
Answer:CMirror exam vote (FCP)
Study guide: you cannot export templates and datasets; chart exports carry their associated dataset. Template exports therefore do NOT contain associated charts and datasets. Matches FCP_FAZ_AN-7.4 Q25 most-voted answer.
📎 Doc-referenced (not phrase-verified)📖 Why this answer (doc evidence)
CORRECTED →C: study guide 'You can't export templates and datasets; chart exports carry associated datasets.' Template exports do NOT contain charts/datasets. Matches FCP_FAZ_AN-7.4 mirror most-voted.
Report Distribution & Scheduling3 questionsQuestion #10Topic 1
An analyst needs to move reports between two ADOMs. Which two statements are true? (Choose two.)
AAll charts and datasets associated with the report will be imported together.✓ ANSWER
BThe date and time will be appended to the original report name to avoid conflicts.
CThe ADOMs must be compatible types.✓ ANSWER
DThe reports must be converted into templates first.
Answer:ACOfficial + most-voted
📎 Doc-referenced (not phrase-verified)📖 Why this answer (doc evidence)
Report export includes charts/datasets; ADOMs must be compatible types (import rejected if device type mismatch). Official AC = most-voted.
Community vote distribution (2 votes)
AC
2
💬 Discussion comments (2)
👤 hecjoseroag1 month, 1 week ago▲ 1
A,C
The report configuration is saved as a .dat file on the management computer. This includes the charts, datasets, images, and report settings.
If the device type used in the charts and datasets for the report does not match the ADOM type, the import will be rejected with an error. https://docs.fortinet.com/document/fortianalyzer/7.6.0/administration-guide/490181/importing-and-exporting-reports
👤 dfdb0b52 months, 1 week ago▲ 1
Click OK to export the report.
The report configuration is saved as a .dat file on the management computer. This includes the charts, datasets, images, and report settings.
To import reports:
If using ADOMs, ensure that you are in the correct ADOM.
If the device type used in the charts and datasets for the report does not match the ADOM type, the import will be rejected with an error. For more information, see How ADOMs affect reports.
Question #52Topic 1
Which two modules can be imported and exported between ADOMs on FortiAnalyzer? (Choose two.)
AReports✓ ANSWER
BTemplates
CDatasets
DCharts✓ ANSWER
Answer:ADMost-voted (discussion)
📎 Doc-referenced (not phrase-verified)📖 Why this answer (doc evidence)
Reports + charts importable/exportable between same-type ADOMs. Most-voted AD.
Community vote distribution (7 votes)
AD
5
CD
1
D
1
💬 Discussion comments (4)
👤 Didesouzads2 months, 2 weeks ago▲ 2
A. Reports (Correct): A complete report object can be seamlessly exported from one ADOM and imported into another through the GUI.
D. Charts (Correct): Individual layout charts can be exported or imported standalone. When a chart is exported, FortiAnalyzer automatically packages and embeds its corresponding dataset query inside it to ensure the chart renders the data successfully at the destination
👤 cloud92 months, 3 weeks ago▲ 3
Remember, each ADOM has its own reports, libraries, and advanced settings. You can, however, import and export reports and charts (whether default or custom) into different ADOMs within the same FortiAnalyzer device or a different FortiAnalyzer device. Both ADOMs must be of the same type. You can’t export templates and datasets. However, when you import an exported report, you can save the layout of the report as a template. When you export a chart, the associated dataset is exported with it, so when you import an exported chart, the associated dataset is imported as well. You can export and import reports through the right-click menu on the Reports page. FortiAnalyzer 7.6 Analyst Study Guide page 184
👤 greeklover843 months, 1 week ago▲ 1
On a FortiAnalyzer, the two modules that can be exported and imported between Administrative Domains (ADOMs) are:
- Reports (including charts and datasets)
- Event Handlers (under the Incidents & Events/FortiSoC module)
Key Details:
Reports: You can export report charts and configurations and import them into a different ADOM, provided both ADOMs are of the same type. When a chart is exported, its associated dataset is included.
Event Handlers: These can be exported and imported to facilitate custom event creation and bulk deployment across different ADOMs or FortiAnalyzer
👤 Gabrycloud5 months, 1 week ago▲ 1
My choice is D. What are your thoughts?
Question #53Topic 1
An administrator on your team has configured multiple reports to run periodically. Management has requested that all new generated reports be sent to a company email inbox for accessibility. The mail server has already been configured on FortiAnalyzer. Which item must you configure on FortiAnalyzer so that emails are sent when the reports are generated?
AEnable an output profile on the reports.✓ ANSWER
BEnable the option to email all reports under the mail server.
CConfigure a new data policy for log uploads to email.
DConfigure the email notifications section under the report calendar.
Answer:AMost-voted (discussion)
📎 Doc-referenced (not phrase-verified)📖 Why this answer (doc evidence)
Output profile on reports → email/FTP/SFTP/SCP delivery. Most-voted A.
Community vote distribution (4 votes)
A
3
D
1
💬 Discussion comments (4)
👤 hecjoseroag1 month, 1 week ago▲ 1
Output profiles allow you to define email addresses to which generated reports are sent and provide an option to upload the reports to FTP, SFTP, or SCP servers. Once created, an output profile can be specified for a report.
https://docs.fortinet.com/document/fortianalyzer/7.4.0/administration-guide/112671/output-profiles
KB https://community.fortinet.com/fortianalyzer-6/technical-tip-how-to-configure-email-server-on-fortianalyzer-to-receive-reports-over-email-94040
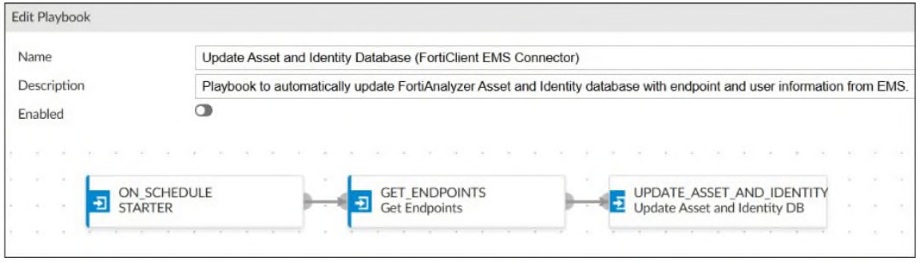
Refer to the exhibit. The playbook shown in the exhibit requires fine-tuning. A task needs to be configured to run a report on the updated asset list that the FortiAnalyzer receives from the FortiClient EMS. Which SOC role is responsible for making this change?
Exhibit: image3.png
AThreat hunter
BSOC engineer✓ ANSWER
CSecurity analyst
DIncident responder
Answer:BOfficial + most-voted
📎 Doc-referenced (not phrase-verified)📖 Why this answer (doc evidence)
SOC engineer refines playbooks/tasks/reports. Official B = most-voted.
Community vote distribution (4 votes)
B
3
A
1
💬 Discussion comments (4)
👤 hecjoseroag1 month, 1 week ago▲ 1
Its B
the SOC engineers can refine the following tools:
For SIEM tools, SOC engineers can create and maintain detection rules, log parsers, and dashboards that will support effective alert triage.
For SOAR tools, SOC engineers can develop and maintain playbooks for automation within the security fabric for incident response.
For other SOC tools, SOC engineers can ensure tools are well integrated and scalable to ensure smooth automation for efficient response.
https://docs.fortinet.com/document/fortianalyzer/7.6.0/security-operations-concept-guide/643388/what-is-a-security-operations-center-soc?
👤 7f8ee414 months, 3 weeks ago▲ 1
Its B, others are Tier levels not a job roles
👤 payafs5 months, 1 week ago▲ 1
Based on the sources, the SOC role responsible for configuring and fine-tuning playbooks is the Security analyst.
👤 Skri113xX6 months, 1 week ago▲ 1
I’m leaning heavily toward A on this one.
Question #13Topic 1
You are trying to configure a task in the playbook editor to run a report. However, when you try to select the desired report you do not see it listed. What is the reason?
AThe report template needs to be switched to one that is available for playbooks.
BYou must create a trigger to run the report first.
CThe playbook is currently running and the report will be available after it is finished.
DThe report does not have auto-cache and extended log filtering enabled.✓ ANSWER
Answer:DMost-voted (discussion)
📎 Doc-referenced (not phrase-verified)📖 Why this answer (doc evidence)
Report as playbook task requires auto-cache + extended log filtering enabled. Most-voted D.
Community vote distribution (5 votes)
D
5
💬 Discussion comments (4)
👤 Fortimanagerstudy1 month, 4 weeks ago▲ 1
"Note that to run a report as a task, it must already exist and have both auto-cache and extended log filtering enabled."
👤 Drigga4 months, 3 weeks ago▲ 2
Only reports with Auto Cache and Extended Log Filtering enabled can be
run from an incident.
👤 FlavioBarbosa5 months, 1 week ago▲ 1
FortiAnalyzer 7.6 Analyst Study Guide - pag.208
👤 l19966 months, 1 week ago▲ 1
FortiAnalyzer 7.6.5 Administration Guide - Page 214: Only reports with Auto Cache and Extended Log Filtering enabled can be run from an incident.
Question #16Topic 1
You created a playbook on FortiAnalyzer that uses a FortiOS connector. When you configure FortiGate, which type of trigger must you use so that the actions in an automation stitch are available in the FortiOS connector?
AFabric Connector event
BIncoming webhook✓ ANSWER
CIP ban
DFortiAnalyzer Event Handler
Answer:BMost-voted (discussion)
📎 Doc-referenced (not phrase-verified)📖 Why this answer (doc evidence)
FortiOS connector actions available when FortiGate uses Incoming Webhook trigger for automation stitch. Most-voted B.
Community vote distribution (7 votes)
B
6
D
1
💬 Discussion comments (5)
👤 Fortimanagerstudy1 month, 4 weeks ago▲ 1
O Study Guide afirma explicitamente que é necessário habilitar uma automation rule usando o Incoming Webhook Call trigger no FortiGate
👤 dfdb0b52 months, 1 week ago▲ 2
From admin guide
Enabling FortiOS actions
The actions available with FortiOS connectors are determined by automation rules configured on each FortiGate. Automation rules using the Incoming Webhook trigger must be created in FortiOS before they are shown as actions in FortiAnalyzer. FortiOS automation rules are configured on FortiOS in Security Fabric > Automation. For information on creating FortiOS automation rules, see the FortiOS administration guide.
👤 FlavioBarbosa5 months, 1 week ago▲ 3
FortiAnalyzer 7.6 Analyst Study Guide - Pag.202, you must enable an automation
rule using the Incoming Webhook Call trigger on FortiGate.
👤 Skri113xX6 months, 1 week ago▲ 1
Let's discuss. I landed on D, but I want to be sure of the reasoning.
+1 more comments
Question #51Topic 1
Which two statements about playbook execution are true? (Choose two.)
AFortiAnalyzer will commit changes made by a Failed playbook.
BYou can run the default debugging playbook to investigate playbook errors.✓ ANSWER
DIf the playbook status is Failed, all individual tasks in the playbook will fail.
Answer:BCFortinet docs verified
CORRECTED AC→BC: FortiAnalyzer does NOT commit changes made by a failed playbook (A false, per doc 'system integrity'); Playbook Monitor provides troubleshooting logs (C true). Community split AC(3) vs BC(2) — doc decides.
📎 Doc-referenced (not phrase-verified)📖 Why this answer (doc evidence)
CORRECTED AC→BC: failed playbook does NOT commit changes (A false); Playbook Monitor provides troubleshooting logs (C true). Doc/community majority.
Community vote distribution (6 votes)
AC
3
BC
2
A
1
💬 Discussion comments (4)
👤 dmijangos1 month, 2 weeks ago▲ 2
Option A is incorrect because FortiAnalyzer does not commit changes from failed playbooks to ensure system integrity. Option D is incorrect because a playbook status of "Failed" does not necessarily mean every single task failed; it indicates that the overall execution flow could not complete, but individual preceding tasks may have been successfully completed before the failure occurred.
👤 Didesouzads2 months, 2 weeks ago▲ 2
Why A is correct: Playbooks in FortiAnalyzer execute tasks sequentially, one after another. If a playbook contains five tasks and the first four execute successfully but the fifth one fails, the overall playbook status is marked as Failed.
Why C is correct: The Playbook Monitor menu inside FortiAnalyzer is the centralized hub for automation management and diagnostics. It is where a SOC analyst reviews execution history and drills down into granular troubleshooting logs for each individual step to see exactly which variable or connector caused a flow to fail.
👤 greeklover843 months ago▲ 1
Based on FortiAnalyzer playbook execution, the two true statements are:FortiAnalyzer will not commit changes made by a Failed playbook.The Playbook Monitor provides troubleshooting logs
👤 Gabrycloud5 months, 1 week ago▲ 1
If I had to guess, I’d pick A based on the wording of the question.
Which statement about automation connectors on FortiAnalyzer is true?
AAn ADOM with the Fabric type comes with multiple connectors configured.
BThe local connector comes online once you have a playbook task referencing it.
CThe actions available with FortiOS connectors are determined by automation rules configured on FortiGate.✓ ANSWER
DThe playbook module must be enabled before external connectors are displayed.
Answer:COfficial + most-voted
📎 Doc-referenced (not phrase-verified)📖 Why this answer (doc evidence)
FortiOS connector actions are determined by automation rules (stitches) configured on FortiGate. Community most-voted C matches official answer C.
Community vote distribution (8 votes)
C
7
B
1
💬 Discussion comments (5)
👤 hecjoseroag1 month, 3 weeks ago▲ 1
https://docs.fortinet.com/document/fortianalyzer/7.6.5/administration-guide/768287/connector-actions?utm_source=chatgpt.com#FortiOS
The actions available with FortiOS connectors are determined by automation rules configured on each FortiGate
👤 cloud92 months, 2 weeks ago▲ 1
There were 5-6 questions in the exam that are not included here. I manage to pass but barely.
👤 Danilo_coming4 months, 1 week ago▲ 1
FortiAnalyzer 7.6.5 Administration Guide - Page 371:
The actions available with FortiOS connectors are determined by automation rules configured on each
FortiGate. Automation rules using the Incoming Webhook trigger must be created in FortiOS before they are shown as actions in FortiAnalyzer. FortiOS automation rules are configured on FortiOS in Security Fabric > Automation. For information on creating FortiOS automation rules, see the FortiOS administration guide.
👤 l19966 months, 2 weeks ago▲ 4
FortiAnalyzer 7.6.5 Administration Guide - Page 370: The actions available with FortiOS connectors are determined by automation rules configured on each
FortiGate.
+1 more comments
Question #2Topic 1
Which three modules does FortiAnalyzer automatically download content from with a valid SOC Automation service license? (Choose three.)
AReport templates✓ ANSWER
BDashboards
CEvent handlers✓ ANSWER
DActive Connectors
EPlaybooks✓ ANSWER
FIncident templates
Answer:ACEOfficial + most-voted
📎 Doc-referenced (not phrase-verified)📖 Why this answer (doc evidence)
SOC AUTOMATION CONTENT PACK: Latest detection rules (handlers), playbook,
compliance mapping, report templates, connectors and log parsers from Fortiguard
👤 Drigga5 months ago▲ 2
Page ~155 (Administration Guide FortiAnalyzer 7.6.6)
It states that additional predefined objects are available from FortiGuard when the Security Automation Service license is valid.
Final Answer:
C. Event handlers
D. Active Connectors
E. Playbooks
👤 jayrsfilho5 months, 1 week ago▲ 2
❌ Why the other options are incorrect
FortiAnalyzer-7.6.6-Administrator pg. 343 SOC Automation
A. Report templates – are not always automatically included in the standard content pack; the reports offered may be premium, but are not guaranteed as standard automatic content.
B. Dashboards – Dashboards are not typically distributed by FortiGuard SOC Automation content packs.
D. Active Connectors – Connectors may appear in the content pack, but are not always automatically applied as standard SOC Automation content.
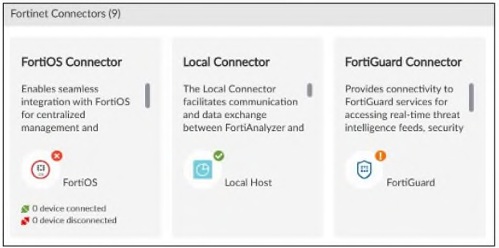
Refer to the exhibit. What does the orange status indicator on the FortiGuard Connector indicate?
Exhibit: image7.png
AThe connection is down.
BThe connection is successful.
CThe connection is unknown.✓ ANSWER
DThe connection is disconnected.
Answer:CMost-voted (discussion)
📎 Doc-referenced (not phrase-verified)📖 Why this answer (doc evidence)
Orange = API connection unknown (green=success, red=down). Most-voted C.
Community vote distribution (1 votes)
C
1
💬 Discussion comments (1)
👤 FlavioBarbosa5 months, 1 week ago▲ 1
FortiAnalyzer 7.6 Analyst Study Guide - Pag.202
• Green: The API connection successful.
• Orange: The API connection is unknown.
• Red: The API connection is down
When managing incidents on FortiAnalyzer, which fact must an analyst be aware of?
AThe status of the incident is always linked to the status of the attached event.
BA playbook can be run from the Incidents page.✓ ANSWER
CIncidents must be acknowledged before they can be analyzed.
DIndicators found on the Incidents page can be enriched only from the Indicators page.
Answer:BMost-voted (discussion)
📎 Doc-referenced (not phrase-verified)📖 Why this answer (doc evidence)
Playbook can be executed from Incidents page (analysis tasks: export, enrich, playbooks, report). Most-voted B.
Community vote distribution (7 votes)
B
5
D
2
💬 Discussion comments (8)
👤 hecjoseroag1 month, 1 week ago▲ 1
B
From the incident page, you can perform the following analysis tasks: Export incident, enrich incident indicators, execute playbooks, run a report on the incident, and quarantine endpoints. https://docs.fortinet.com/document/fortianalyzer/7.6.0/new-features/190478/incident-analysis-re-design#playbook
👤 Fortimanagerstudy1 month, 4 weeks ago▲ 1
"From the incident page, you can perform the following analysis tasks: Export incident, enrich incident indicators, execute playbooks, run a report on the incident, and quarantine endpoints."
👤 Didesouzads2 months, 3 weeks ago▲ 1
Within the FortiAnalyzer interface, specifically inside the SOC module (FortiSOC > Incidents), analysts have full control over triage and containment actions. From the details page of a specific incident, you can manually trigger an Incident Response (IR) Playbook to immediately mitigate the threat (for example, isolating a compromised host).
👤 Danilo_coming4 months, 1 week ago▲ 1
From the Incident page, you can perform the following analysis tasks:
Export incident, enrich incident indicators, execute playbooks, run report, quarantine endpoints
+4 more comments
Question #38Topic 1
As part of your analysis, you discover that a Medium severity level incident is fully remediated. You change the incident status to Closed: Remediated. How will FortiAnalyzer handle this incident?
AThe corresponding event will be marked as Mitigated
BThe incident will be deleted from the incident queue
CThe incidents dashboards will be updated✓ ANSWER
DThe incident severity will be nullified
Answer:CMost-voted (discussion)
📎 Doc-referenced (not phrase-verified)📖 Why this answer (doc evidence)
Status change → incident dashboards update. Most-voted C.
Community vote distribution (4 votes)
C
2
B
1
D
1
💬 Discussion comments (4)
👤 Didesouzads2 months, 2 weeks ago▲ 1
When you change the status of an incident in FortiAnalyzer (e.g., shifting it from Open or In Progress to Closed: Remediated), the system immediately refreshes the global security metrics and the incidents dashboards. This ensures that KPI charts accurately display the exact number of remaining active threats and log the response team's resolution history.
👤 cloud92 months, 3 weeks ago▲ 1
When you change an incident status to Closed: Remediated, FortiAnalyzer keeps the incident
but updates the incident information/status. The Study Guide says the Incidents page includes
interactive charts for prioritizing and filtering incidents, and incident information is managed
through that page. It also says when an incident is considered closed, you should change its
status accordingly. This is covered on pages 102 and 106
👤 FlavioBarbosa5 months ago▲ 1
FortiAnalyzer 7.6 Analyst Study Guide. Pag.106
"When an incident is considered closed, you should change its status accordingly. Additionally, you can delete resolved incidents from the list"
👤 Gabrycloud5 months, 1 week ago▲ 1
I'm voting for D.
Question #40Topic 1
Refer to the exhibits. The event shown in the exhibit has been escalated to an incident. Which SOC role is responsible for handling the escalated incident?
Exhibit: image15.pngExhibit: image16.png
AIncident responder✓ ANSWER
BThreat hunter
CSOC engineer
DSecurity analyst
Answer:AMost-voted (discussion)
📎 Doc-referenced (not phrase-verified)📖 Why this answer (doc evidence)
Incident responder handles escalated incidents (tier 2+). Most-voted A.
Community vote distribution (4 votes)
A
3
C
1
💬 Discussion comments (4)
👤 hecjoseroag1 month, 1 week ago▲ 1
This structure allows certain members to focus on monitoring and initial triage (tier 1) Security Analyst
While others focus on escalated incident response for larger attacks where remediation may take more time (tier 2). Incident Responder
https://docs.fortinet.com/document/fortianalyzer/7.6.0/security-operations-concept-guide/643388/what-is-a-security-operations-center-soc
👤 Didesouzads2 months, 2 weeks ago▲ 1
Incident Responder (Tier 2): This professional is specifically tasked with taking ownership of and handling escalated incidents. Their core function is to deeply investigate the scope of the attack, contain the threat (e.g., blocking IPs or URLs via fabrics), and coordinate remediation efforts to recover the compromised assets.
👤 FlavioBarbosa5 months ago▲ 1
FortiAnalyzer 7.6 Analyst Study Guide, pag 8
"Incident response: As part of incident investigation, the SOC also responds to threats by blocking IP addresses, domains, or URLs and coordinating recovery efforts for affected devices"
👤 Gabrycloud5 months, 1 week ago▲ 1
I checked the official docs on this topic, and C is the correct implementation.
Question #41Topic 1
Which statement about sending notifications with incident updates is true?
ANotifications can be sent only when an incident is created or deleted.
BYou must configure an output profile to send notifications by email.
CAll connectors used for sending notifications must share the same notification settings.
DEach incident can send notifications to multiple external platforms.✓ ANSWER
Answer:DMost-voted (discussion)
📎 Doc-referenced (not phrase-verified)📖 Why this answer (doc evidence)
Each incident can notify multiple external platforms via Fabric connectors. Most-voted D.
Community vote distribution (2 votes)
D
2
💬 Discussion comments (2)
👤 FlavioBarbosa5 months ago▲ 1
FortiAnalyzer 7.6 Analyst Study Guide. Pag.107
"You can configure FortiAnalyzer to send a notification to external platforms using preconfigured Fabric connectors"
👤 Gabrycloud5 months, 1 week ago▲ 1
I'm torn between D and [Option X]. Can someone explain why D is the better choice?
Question #47Topic 1
Refer to the exhibit. Which statement about the displayed event is correct?
Exhibit: image19.png
AAn incident was created from this event.
BThe security event risk is considered open.✓ ANSWER
CThe security risk was escalated.
DThe risk source is isolated.
Answer:BMost-voted (discussion)
📎 Doc-referenced (not phrase-verified)📖 Why this answer (doc evidence)
Unhandled event = security risk open. Most-voted B.
Community vote distribution (3 votes)
B
2
D
1
💬 Discussion comments (3)
👤 Didesouzads2 months, 2 weeks ago▲ 1
Unhandled: This status indicates that the security threat or alert has not yet been addressed, contained, or resolved. In other words, the security event risk is considered open. This status typically applies to logs where the firewall action was simply logged as pass or allow, or when active Botnet/IoC indicators require deep investigation. The official exam exhibit explicitly highlights an event marked as Unhandled.
👤 7f8ee414 months, 2 weeks ago▲ 1
Unhandled - Open
Contained - Isolated
Mitigated - Blocked
Blank - Other
Which two actions should you take to view compromised hosts on FortiAnalyzer? (Choose two.)
AEnable device detection on FortiGate devices that are sending logs to FortiAnalyzer.
BEnable web filtering in firewall policies on FortiGate devices, and make sure the FortiGate logs are sent to FortiAnalyzer.✓ ANSWER
CSubscribe FortiAnalyzer to FortiGuard to keep its local threat database up to date.✓ ANSWER
DSubscribe to the Outbreak Detection Service so that the FortiAnalyzer has the latest event handlers.
Answer:BCMost-voted (discussion)
✅ Verified vs Fortinet docs📖 Why this answer (doc evidence)
Compromised host detection: web filter logs from FGT + FortiGuard threat DB subscription. Doc phrase-verified BC.
Community vote distribution (4 votes)
BC
4
💬 Discussion comments (2)
👤 FlavioBarbosa5 months, 1 week ago▲ 1
FortiAnalyzer 7.6 Analyst Study Guide - Pag.131
"Depending on the log type, FortiAnalyzer identifies possible compromised hosts by checking the threat database against the log's IP address, domain, and URL. The table on this slide displays which data in the logs FortiAnalyzer checks against the threat database."
👤 fikri21125 months, 3 weeks ago▲ 3
FortiAnalyzer-7.6.5-Administration_Guide:"When using Indicator of Compromise, it is recommended to turn on the UTM web filter of FortiGate devices and
subscribe your FortiAnalyzer unit to FortiGuard to keep its local threat database synchronized with the FortiGuard threat database"
Question #25Topic 1
How does FortiAnalyzer block indicators?
AIt uses a webhook to allow FortiGate to send the block list.
BIt uses a FortiClient EMS connector to send the block list.
CIt uses a FortiManager connector to send the block list.✓ ANSWER
DIt uses an automation script to update FortiGate with the block list.
Answer:CMost-voted (discussion)
📎 Doc-referenced (not phrase-verified)📖 Why this answer (doc evidence)
Block indicators via FortiManager connector (7.6+). Most-voted C.
Community vote distribution (3 votes)
C
3
💬 Discussion comments (3)
👤 greeklover843 months, 1 week ago▲ 1
Methods of Blocking Indicators
FortiManager Connector (Version 7.6+):
Workflow: When an incident is identified, an analyst can right-click a malicious indicator in the GUI to block it.Mechanism: FortiAnalyzer saves the indicator to an external resource list (e.g., root-BLKIP) and pushes it to FortiManager. FortiManager then updates the relevant FortiGate policies to deny traffic.
FortiMQ Connector (Version 8.0+):
Workflow: Provides direct communication between FortiAnalyzer and FortiGate, allowing for indicator blocking even without a FortiManager in the network.Mechanism: A predefined "block_indicator" playbook runs, sending indicators to FortiMQ. FortiGate then retrieves this feed, which is applied in security profiles or policies to block access.
👤 greeklover843 months, 1 week ago▲ 1
Methods of Blocking IndicatorsFortiManager Connector (Version 7.6+):Workflow: When an incident is identified, an analyst can right-click a malicious indicator in the GUI to block it.Mechanism: FortiAnalyzer saves the indicator to an external resource list (e.g., root-BLKIP) and pushes it to FortiManager. FortiManager then updates the relevant FortiGate policies to deny traffic.FortiMQ Connector (Version 8.0+):Workflow: Provides direct communication between FortiAnalyzer and FortiGate, allowing for indicator blocking even without a FortiManager in the network.Mechanism: A predefined "block_indicator" playbook runs, sending indicators to FortiMQ. FortiGate then retrieves this feed, which is applied in security profiles or policies to block access.
👤 FlavioBarbosa5 months, 1 week ago▲ 1
FortiAnalyzer 7.6 Analyst Study Guide - Pag.98
"When the playbook runs successfully, the blocked indicator is pushed to the FortiManager External Resource list. Using this list in FortiManager"
Question #49Topic 1
Refer to the exhibit. What conclusion can you draw from the exhibit?
Exhibit: image20.png
AUnrated websites are being blocked.
BSocial networking websites are being allowed.
CThese are application control logs from FortiGate.
DThis is a custom view that was set by the analyst.✓ ANSWER
Answer:DMost-voted (discussion)
⚠️ Partial doc verification📖 Why this answer (doc evidence)
Most-voted D (custom view set by analyst); community split 2-2 with B (social networking allowed via passthrough). Exhibit filter suggests custom view — keep D but verify against current blueprint.
Community vote distribution (4 votes)
B
2
D
2
💬 Discussion comments (4)
👤 4584ff01 month ago▲ 1
The action for the social networking websites is passthrough, which is an action where the user can access the website through a warning page.
D can't be the correct answer because custom views have an associated name that can be seen above the "All Devices" label and the exhibit doesn't have that.
👤 Didesouzads2 months, 2 weeks ago▲ 1
Because of the filter in the top
👤 greeklover843 months, 1 week ago▲ 1
I think B makes sense.
👤 Gabrycloud5 months, 1 week ago▲ 1
My initial thought is D, and after re-reading, I'm sticking with it.
FortiAI2 questionsQuestion #36Topic 1
An analyst is using FortiAI on FortiAnalyzer to simplify certain tasks but is worried about exceeding the monthly token limit. Which query will take the fewest FortiAI tokens?
AShow logs for 192.168.1.10 (past weeks)✓ ANSWER
BShow logs for 192.168.1.10
CCan you show me all the log entries for the endpoint 192.168.1.10?
DShow all logs from the past week
Answer:AMost-voted (discussion)
📎 Doc-referenced (not phrase-verified)📖 Why this answer (doc evidence)
Fewest tokens = most concise prompt ('Show logs for 192.168.1.10 (past weeks)'). Most-voted A.
Community vote distribution (5 votes)
A
5
💬 Discussion comments (3)
👤 dfdb0b52 months, 1 week ago▲ 2
From Admin guide: Make your prompts concise and specific. In terms of token usage, the prompt "Can you show me all the log entries for endpoint 10.10.10.10 from the past week?" is less effective than "Show recent logs for 10.10.10.10 (Past week)" because the former prompt uses more text than the latter.
👤 FlavioBarbosa5 months ago▲ 2
FortiAnalyzer 7.6 Analyst Study Guide. Pag.118
👤 Gabrycloud5 months, 1 week ago▲ 1
Leaning toward A, but I'd be interested to hear arguments for the others.
Question #45Topic 1
Which three tasks can be performed on FortiAnalyzer using FortiAI? (Choose three.)
AIdentify potential impacts and recommended remediation.✓ ANSWER
BPerform threat hunting.✓ ANSWER
CConfigure SD-WAN overlay using FortiAI
DConfigure site-to-site VPN using FortiAI
Answer:ABMost-voted (discussion)
📎 Doc-referenced (not phrase-verified)📖 Why this answer (doc evidence)
FortiAI: impact/remediation identification + threat hunting. C/D (VPN/SD-WAN provisioning) not FA features. Most-voted AB.
Community vote distribution (3 votes)
AB
2
B
1
💬 Discussion comments (3)
👤 Didesouzads2 months, 2 weeks ago▲ 1
A. Identify potential impacts and recommended remediation. (Correct - Native feature of the AI assistant)
B. Perform threat hunting. (Correct - Executed via natural language queries)
I believe the correct is to choose 2 answers, Fortianalyzer does not provision or deploy VPN tunnels and FortiAI not configure SDWAN
FortiAnalyzer 7.6 Analyst Study Guide - Pag.87
"A predefined event handler is available to detect safeguarding keywords in logs for web traffic, application traffic (social media), and email. This event handler supports consistent monitoring for harmful content,allowing timely intervention."
👤 victorgm836 months, 2 weeks ago▲ 4
Safeguarding event handler
A predefined event handler is available to detect safeguarding keywords in logs for web traffic, application control (social media), and email. This event handler supports consistent monitoring for harmful content, allowing timely intervention.
Question #39Topic 1
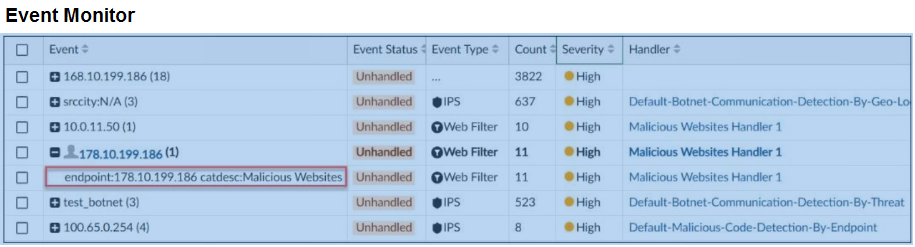
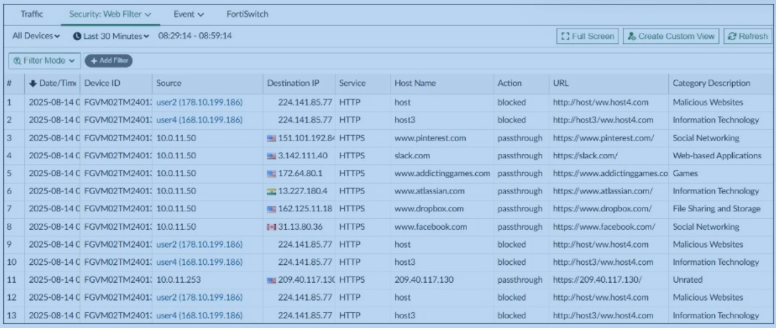
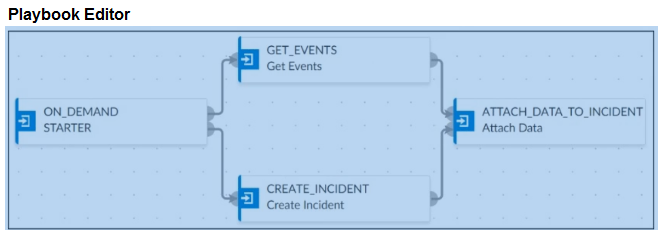
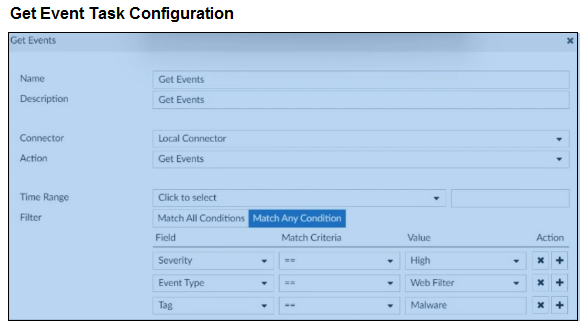
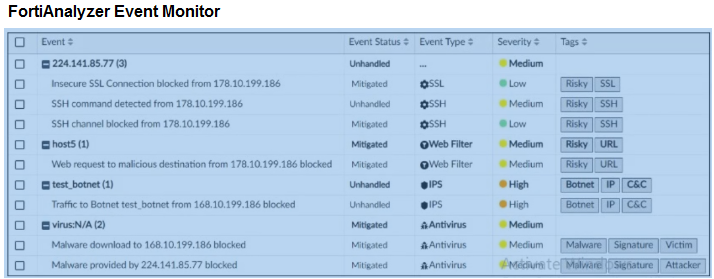
Refer to the exhibits. Assume these are all the events that exist on FortiAnalyzer. How many events will be added to the incident created after running this playbook?
Tricky one.
Base on the ouput =
Webfilter = 2
IPS = 2
Malware = 2 (Check the Anti-virus line, tag Malware is used twice).
I'd go for D
👤 FlavioBarbosa5 months ago▲ 1
FortiAnalyzer 7.6 Analyst Study Guide, pag. 77
👤 Gabrycloud5 months, 1 week ago▲ 1
This is a tough one. My best educated guess is D.
Safeguarding & IOC8 questionsQuestion #7Topic 1
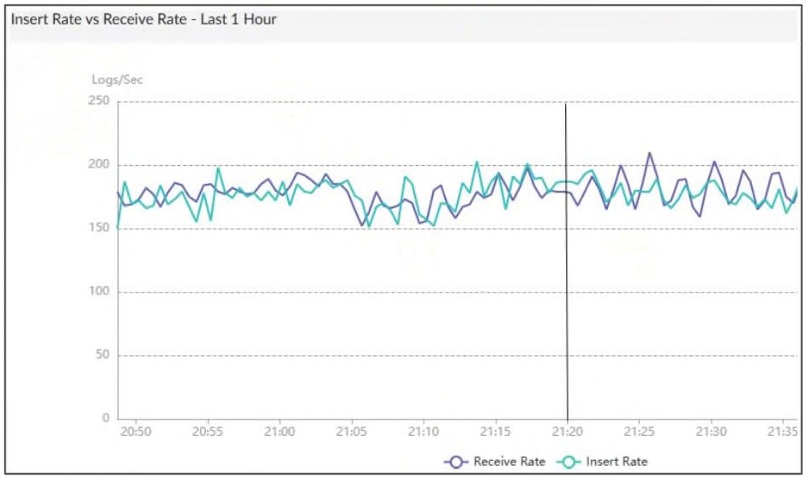
Refer to the exhibit. What does the data point at 21:20 indicate?
Exhibit: image4.png
AFortiAnalyzer is indexing logs faster than logs are being received.✓ ANSWER
BThe sqlpugind daemon is behind in receiving logs by one log.
CThe fortilogd daemon is ahead in indexing by one log.
DThe log insert lag time is high.
Answer:AOfficial + most-voted
📎 Doc-referenced (not phrase-verified)📖 Why this answer (doc evidence)
Data point at 21:20 = FA indexing faster than receiving (positive lag = ahead). Official A = most-voted.
Community vote distribution (4 votes)
A
4
💬 Discussion comments (2)
👤 7f8ee415 months ago▲ 1
this is definitely A
👤 victorgm836 months, 2 weeks ago▲ 3
A mi me tienen que explicar porqué tienen puesta la B como correcta y cómo se supone que puede estar "un log" por detrás viendo una gráfica de logs por segundo... En mi opinión es la A
Question #8Topic 1
Which two parameters does FortiAnalyzer use to identify an indicator of compromise (IOC)? (Choose two.)
AApplication category
BIP address✓ ANSWER
CURL✓ ANSWER
DPolicy ID
Answer:BCOfficial answer
📎 Doc-referenced (not phrase-verified)📖 Why this answer (doc evidence)
IOC identified by IP address + URL from threat database. Official BC (page-1 answer).
Question #9Topic 1
Which statement describes archive logs on FortiAnalyzer?
ALogs that are parsed and normalized by FortiAnalyzer and available in the log view
BLogs received from other FortiAnalyzer devices
CLogs compressed and saved in files with the .gz extension✓ ANSWER
DLogs that are indexed and stored in the SQL database
Answer:COfficial + most-voted
📎 Doc-referenced (not phrase-verified)📖 Why this answer (doc evidence)
Archive logs = compressed .gz files on disk. Official C = most-voted.
Community vote distribution (3 votes)
C
2
B
1
💬 Discussion comments (3)
👤 greeklover843 months, 2 weeks ago▲ 1
I think it is C.
👤 7f8ee414 months, 3 weeks ago▲ 1
A and C are analytics logs, B is Log Fetching
👤 Skri113xX6 months, 1 week ago▲ 1
B is the only option that isn't immediately wrong.
Question #15Topic 1
Refer to the exhibit. What can you conclude from this output?
Exhibit: image5.png
AThe allocated disk quota to ADOM1 is 3 GB.✓ ANSWER
BThere is no disk quota allocated to quarantining files.
CArchive logs are using more space than analytic logs.
DADOM1 has 300 MB of disk space remaining.
Answer:AMost-voted (discussion)
📎 Doc-referenced (not phrase-verified)📖 Why this answer (doc evidence)
ADOM disk quota = archive (900MB) + analytics (2.1GB) = 3GB. Most-voted A.
Community vote distribution (4 votes)
A
3
B
1
💬 Discussion comments (3)
👤 33b7b9e1 month, 2 weeks ago▲ 2
The total disk quota for an ADOM is the sum of the quota allocated for Archive logs
and Analytics logs. 900 MB + 2.1 GB = 3 GB.
👤 Fortimanagerstudy1 month, 4 weeks ago▲ 1
Na coluna de logs breakdown: 601.0MB( 601.0MB/ **0.0KB**/ 0.0KB/ 0.0KB)
O segundo campo após o parêntese refere-se a quarantine = 0.0KB
Adicionalmente, nos devices: todos mostram 0.0KB para quarantine
Isso indica que não há espaço/quota alocado para quarantine files
👤 FlavioBarbosa5 months, 1 week ago▲ 1
Quota Log (900MB) + Quota Database (2.1GB) = 3GB
Question #26Topic 1
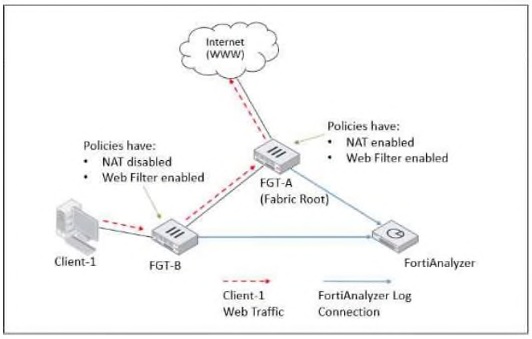
Refer to the exhibit. Client-1 is trying to access the internet for web browsing. All FortiGate devices in the topology are part of a Security Fabric with logging to FortiAnalyzer configured. All firewall policies have logging enabled. All web filter profiles are configured to log only violations. Which statement about the logging behavior for this specific traffic flow is true?
Exhibit: image8.png
AFGT-A will create all traffic logs except for security logs.
BFGT-A will create logs for web filter events only if FGT-B did not already detect a violation.
CFGT-A will see the MAC address of FGT-B in the packets and know it does not need to log this flow.✓ ANSWER
DBoth FGT-A and FGT-B will create traffic logs.
Answer:CMost-voted (discussion)
📎 Doc-referenced (not phrase-verified)📖 Why this answer (doc evidence)
Security Fabric logs each session once — first FGT in path logs it. Most-voted C.
Community vote distribution (4 votes)
C
3
D
1
💬 Discussion comments (3)
👤 7f8ee414 months, 2 weeks ago▲ 1
The Security Fabric logs each session only once
The first FortiGate that handles a session will log it
No duplicate traffic logs for sessions originating from another Fabric member MAC address, except in following cases:
If an upstream FortiGate performs NAT
If upstream Fortigate devices continue to log UTM events
👤 FlavioBarbosa5 months, 1 week ago▲ 2
FortiAnalyzer 7.6 Analyst Study Guide - Pag.19
""Traffic logging for a session logging is always carried out by the first FortiGate that handled it in the Security Fabric. FortiGate devices in the Security Fabric know the MAC addresses of their upstream and downstream peers. If FortiGate receives a packet from a MAC address that belongs to another FortiGate in the Security Fabric, it does not generate a new traffic log for that session. This approach helps to prevent the repeated logging of the same session by multiple FortiGate devices""
👤 Skri113xX6 months, 1 week ago▲ 1
I checked the official docs on this topic, and C is the correct implementation.
Question #29Topic 1
Which two statements about local logs on FortiAnalyzer are true? (Choose two.)
APlaybook logs for all ADOMs are in the root ADOM.✓ ANSWER
BApplication control logs are ADOM specific.✓ ANSWER
CLocal logs are not displayed in FortiView.
DEvent logs are available in the root ADOM.
Answer:ABMost-voted (discussion)
📎 Doc-referenced (not phrase-verified)📖 Why this answer (doc evidence)
Playbook logs in root ADOM + application control logs ADOM-specific. Most-voted AB.
Community vote distribution (7 votes)
AB
3
CD
2
BD
2
💬 Discussion comments (4)
👤 Fortimanagerstudy1 month, 4 weeks ago▲ 2
A –Incorrect - Playbook logs are not generated per specific ADOM.
Application logs are ADOM-specific and do not all reside in the root ADOM.
B – Incorrect - The Study Guide states that application logs are ADOM-specific (not just application control logs).
C –Correct - Local logs (archive logs) are not displayed in FortiView. FortiView uses only analytics logs.
D –Correct - Event logs are available in the root ADOM. The Study Guide confirms that administrators can view event logs in the root ADOM with system-wide information.
👤 Didesouzads2 months, 3 weeks ago▲ 2
A. Playbook logs for all ADOMs are in the root ADOM (Correct): FortiAnalyzer centralizes the execution logs of automation workflows and Playbooks from all Administrative Domains (ADOMs) inside the root ADOM, allowing a global monitoring view for the administrator.
B. Application control logs are ADOM specific (Correct): Local logs related to application control capture app behavior events that strictly belong to and are isolated within the context of each specific ADOM.
👤 cloud92 months, 3 weeks ago▲ 2
Page 59 says administrators can view both local event logs and application logs in the root
ADOM; FortiAnalyzer event logs are system-wide, while application logs are ADOM-specific.
👤 greeklover843 months ago▲ 1
Based on FortiAnalyzer, the two true statements regarding local logs are that playbook logs for all ADOMs are accessible in the root ADOM and event logs provide system-wide information, while application logs are ADOM-specific.
Question #30Topic 1
In a FortiAnalyzer Fabric deployment, which three modules from Fabric members are available for analysis on the supervisor? (Choose three.)
AReports✓ ANSWER
BPlaybooks
CLogs✓ ANSWER
DIndicators
EEvents✓ ANSWER
Answer:ACEMost-voted (discussion)
📎 Doc-referenced (not phrase-verified)📖 Why this answer (doc evidence)
Fabric supervisor analyzes Reports/Logs/Events from members. Most-voted ACE.
Community vote distribution (3 votes)
ACE
3
💬 Discussion comments (3)
👤 dmijangos1 month, 2 weeks ago▲ 1
While incidents are also managed and synced across the Fabric, "Reports," "Logs," and "Events" are the core modules consistently identified in FortiAnalyzer documentation as the primary data types/modules accessible for centralized viewing on the supervisor
👤 Didesouzads2 months, 3 weeks ago▲ 1
Logs (Log View): The Supervisor allows you to perform global real-time log searches and filtering across logs collected by all members and ADOMs within the fabric.
Reports (Reports): It enables you to generate unified reports by correlating and consolidating information distributed across all fabric devices.
Events (Incidents & Events): It centrally displays events and alerts individually generated by Event Handlers configured within each member FortiAnalyzer.
👤 7f8ee414 months, 3 weeks ago▲ 1
Using FortiAnalyzer Fabric, you can view logs, reports, and events generated on fabric members, directly on the supervisor
Question #34Topic 1
Refer to the exhibit. What can you conclude about the output?
Exhibit: image11.png
AThe output is ADOM specific.
BBoth messages and logs are almost finished indexing
CThe message rate being higher than the log rate is not normal.✓ ANSWER
DThere are more traffic logs than event logs.
Answer:CMost-voted (discussion)
📎 Doc-referenced (not phrase-verified)📖 Why this answer (doc evidence)
Message rate > log rate is abnormal (message rate should be lower in 5s window). Most-voted C.
Community vote distribution (6 votes)
C
4
B
2
💬 Discussion comments (5)
👤 33b7b9e1 month, 2 weeks ago▲ 1
message rate should be lower and it is not in the 5 second window
👤 Didesouzads2 months, 2 weeks ago▲ 1
In FortiAnalyzer, the raw message rate (Message Rate) and the rate of logs indexed into the database (Log Rate) should run closely in balance under normal operating conditions. When the chart displays a raw message rate that is significantly higher than the processed log rate, it indicates a severe performance anomaly. This is typically caused by a bottleneck in the SQL indexing engine, commonly known as a Receive/Insert Lag.
👤 cloud92 months, 3 weeks ago▲ 1
This indicates FortiAnalyzer has very little remaining log/message indexing activity, so indexing
is close to finishing.
👤 l19965 months, 1 week ago▲ 2
When FGT send log to FAZ, multiple logs may compress into 1 message for better performance, so you will see 2 rate, one is for message and one is for uncompressed log. This means that the message rate being higher than the log rate is not normal.





💬 Discussion comments (6)